
Low Response Rate on Your Job Applications? It's Not the Problem, You Just Haven't Found the Right Method
Why this topic matters
Imagine a job seeker who has sent out fifty applications and received only two positive responses.
What would you tell them to do next?
Most people’s first instinct is: “Should I rewrite my resume?” But that only addresses the surface symptom.
What we see is a low response rate on job applications. But what does “low” actually mean here?
- Is the resume unclear, or are the roles a poor fit?
- Or is your understanding of the market off?
This is exactly why the Data-Driven Job Search method exists.
It gives you a systematic, evidence-based way to move from the vague anxiety of “maybe I’m not good enough” to the concrete question of “what should I improve next?”
Core idea and background
1. What is the Data-Driven Job Search method?
The Data-Driven Job Search method is a data-based framework for job search strategy. Its core purpose is to:
turn an abstract, feelings-driven job search into clear, trackable action metrics.
Think of your job search as a long pipe (a pipeline). Opportunities leak out at every stage, and what we can do is reinforce each joint to reduce the leaks and improve conversion.
The method is built on “one volume number and three conversion rates,” which let you break the whole process into four key metrics:
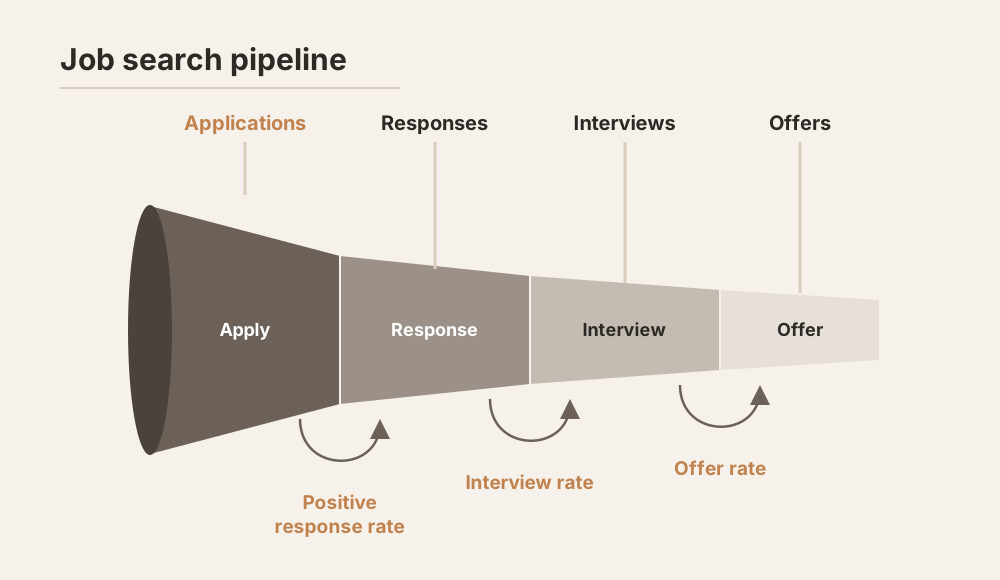
We focus on one volume number and three conversion rates, splitting the whole job search into four key metrics:
- Applications (application volume): How many applications you sent. This is the starting point of the whole journey and the part you control most.
- Positive response rate: The share of your applications that got a positive response (rejection emails don’t count). Usually this is a company sending an online assessment, an initial phone call, or reaching out to you.
- Interview rate: Of all positive responses, the share that actually led to a formal interview. “Interview” here means actually meeting the team or the hiring manager, not just a first call with a recruiter.
- Offer rate: The share of interviews that ended in an offer. This reflects how you came across overall in interviews and how well you fit.
2. Job hunting as math: the offer equation
You can also look at the Data-Driven Job Search method as a formula.
Applications × response rate × interview rate × offer rate = number of offers
The number of offers you end up with comes from the numbers before it.
If your volume is large enough, even a tiny chance will eventually hit (but that’s like buying lottery tickets).
Improve any of the three conversion rates in the middle even a little, though, and your odds of landing a job can rise sharply.
So the key question is:
- Where is my bottleneck, and what should I optimize first?
And these aren’t just job seeker metrics. They’re also the stages of a company’s hiring process.
3. Why look at the job search through these four metrics?
Because these four numbers line up exactly with the four checkpoints in a company’s hiring process where a clear “move forward or reject” decision is made.
What the job seeker sees: a job opens, you hear back, interviews start, and you get an offer.
What the company sees: a job opens, they respond to candidates, they interview, and they make an offer.
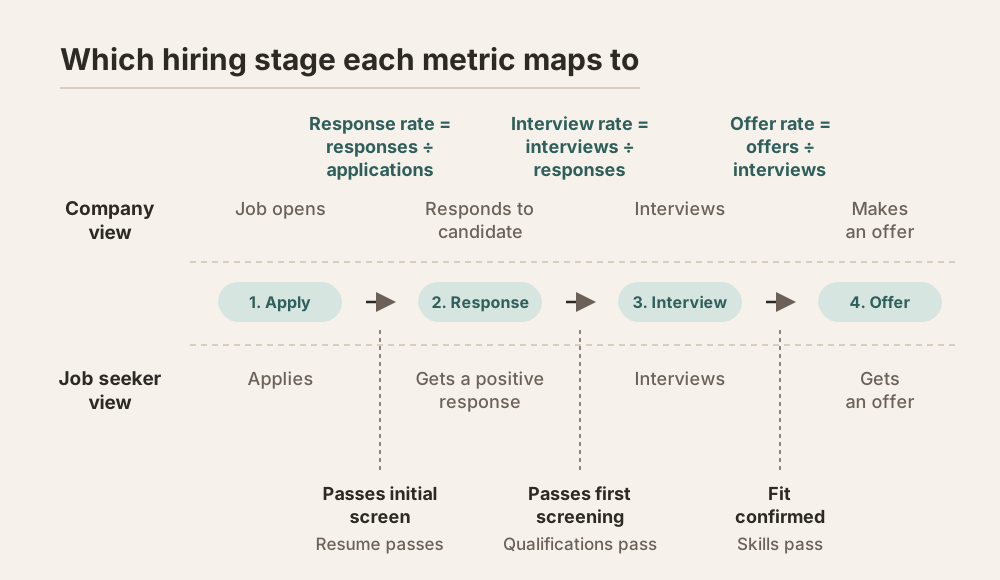
What each stage means:
- Applications show whether you have enough exposure in the job market.
- Response rate means your resume passes (not the best resume, just one that passes). It reflects whether a company is willing to learn more about you.
- Interview rate means your qualifications pass (visa, communication and so on). It’s the key step from being seen to being evaluated.
- Offer rate means your abilities pass (both soft and hard skills). It’s the key measure of how you’re assessed.
They measure quality, not just quantity.
Your response rate tells you about your resume and application strategy.
Your interview rate shows whether early interactions are going smoothly.
Your offer rate helps you reflect on whether you showed your full value in interviews.
From the job seeker’s side, these four metrics are a series of thresholds.
Each one you pass brings you one step closer to the job you want.
We track them not because they guarantee success, but because the data speaks.
It helps you find where you’re stuck, and it also tells you where you’re already doing well, so you can put your effort in the right place.
What to do about a low response rate on job applications
4. Average numbers for the four metrics: a real “conversation with the market”
So how do we use these four numbers? Let’s take entry-level software engineers in the US as an example.
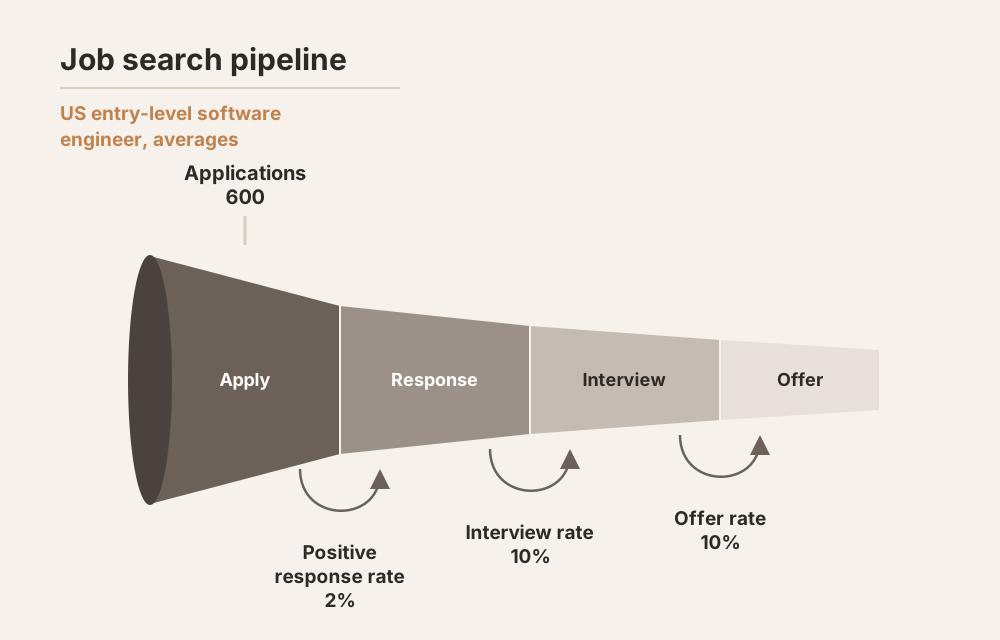
If you want to apply for entry-level software engineering roles in the US, this chart is the real world you may be facing.
It isn’t one person’s story. It’s averaged from hundreds of people job hunting abroad, and it shows how many opportunities drop away on the way from sending a resume to getting an offer.
The image shows a typical job hunting pipeline. Each narrowing section is one round of elimination, one conversion.
- First, you may need to send 600 to 800 applications to get one offer. That’s the starting point, and a mindset to prepare for.
- Next, you may get positive responses from about 1 to 2%, meaning only one or two companies out of every 100 want to learn more about you.
- Of those, about 20% will invite you into a real interview process.
- Finally, only 10% of interviews turn into an actual offer.
You might think 600 is too many. But in the international job market this is the normal range. It’s where the question “are you putting in enough effort?” starts, not “is something wrong with you?”
You don’t have to wait until 800 to succeed. Some people got an offer after 150 applications, and some took a year to get through the whole pipeline.
But this chart gives you a ruler, a reference point.
So you can stop guessing and start adjusting your strategy.
5. Why this method works, and when it doesn’t
This method works best when:
- You’re applying in industries with lots of openings and fast responses
- You can iterate quickly (adjust your strategy every week or two)
- You’re targeting a global market, such as tech, design or consulting career paths
It’s less effective when:
- You’re applying to graduate school, where the cycle is long and there are few places
- You’re targeting a very niche market where few openings are posted in the first place
- You’re not tracking any data at all and acting on gut feeling
Even so, everyone has some skills that apply to high-volume job markets.
What you need to do is figure out which skills fit which markets best, and adjust your strategy accordingly.
6. Case study: what to do about a low response rate of 2 out of 50
Let’s go back to the question at the start.
Say a graduate of a Taiwanese university with five years of experience is applying from Taiwan for software engineering roles in the US, with no visa. They sent 50 applications and got 2 responses. That’s a 4% response rate.
In the US job market, that’s actually very good.
I would suggest they:
- Stop getting stuck on resume tweaks, and instead dig into what those two responses had in common (Did they apply early? Did they have a referral? Did they go through a cold email?)
- Scale up the application strategy that’s working (copy the template that succeeded)
- Start preparing for interviews early
But in the Taiwanese market, where the average response rate is 10%, they would really need to adjust.
- Only then would we look at the overall application strategy, including what to change in the resume
- Or the distance between the roles they’re applying to and their resume
- Or analyze data such as how often their resume gets opened, when rejection emails arrive, and how many applications get no reply at all
It doesn’t guarantee you’ll land a job, but it shows you where you are and what you can do next.
7. From data to strategy: what’s your next step?
- Record first: Start tracking these four numbers today.
- Then analyze: See which stage your conversion rates fall in.
- Then optimize: Pick one conversion rate to start improving (I usually suggest starting with the response rate).
Some people ask: “My conversion rates are so low. Maybe I’m not cut out for this industry?” Don’t rush to conclusions. This is exactly why we break the metrics down: a low conversion rate doesn’t mean you’re not good enough. It only means there’s room to adjust.
What comes next
8. Coming up: what we mean when we talk about input
This article was about tracking results.
Next, I’ll talk about planning your input: how much time and energy to spend, and on what.
This is the part of the Data-Driven Job Search method where people most easily get lost, and also where they have the most room to improve.
About the author
I’m Coach Chiao (George), a career coach and organizational development facilitator. I used to be a software engineer at Amazon, and I’ve helped more than 200 tech professionals move to jobs abroad, with over 3,000 hours of one-on-one conversations and more than 700 workshops.
The Data-Driven Job Search series is my distilled, practical experience. If you’re preparing to change careers, study abroad, or can’t find your direction in your job search, follow along with this series.
Job hunting abroad isn’t easy, but if you want to run this race, I’ll be running it with you.